Solar panel cost in 2026: real prices + financing
What you'll pay per watt, where the money goes, and how financing changed after the federal credit shift.
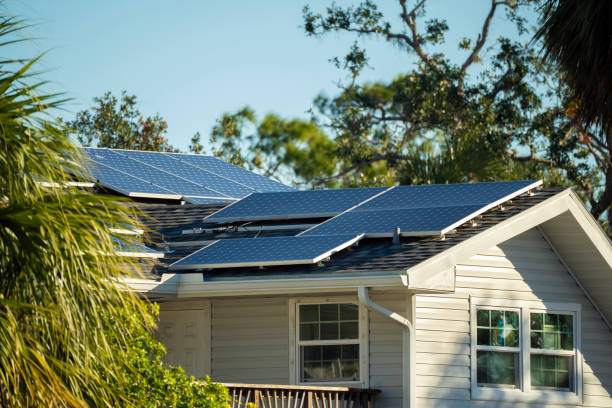
Installed residential solar runs roughly $2.40 to $3.10 per watt before incentives in 2026. On a typical 7.2 kW system that's $17,000 to $22,300, wide enough that two neighbors on the same block can pay thousands apart for similar hardware. The spread exists because hardware is only part of the equation. Labor rates, roof complexity, permitting fees, and the sales channel that connected you to the installer each add their own layer. Understanding where each dollar goes puts you in a stronger negotiating position and helps you separate a fair bid from an inflated one.
National averages are useful as a compass but useless as a contract. A quote in Phoenix will differ from one in Boston not just because of sun hours but because of local permitting costs, utility interconnection timelines, and prevailing labor rates. The only number that matters is the fully loaded price per watt on your specific roof, with every line item visible. If a proposal hides behind a single lump sum with no breakdown, that's your cue to ask harder questions or get another bid.
2026 price range
Price per watt is the standard yardstick. It normalizes system size so you can compare a 6 kW quote against an 8 kW quote on equal footing. In mid-2026, most competitive residential bids land between $2.50 and $2.90 per watt for standard monocrystalline systems with string inverters. Microinverter systems add roughly $0.10 to $0.25 per watt. Premium modules from top-tier manufacturers can push the hardware component higher, but the total installed price often stays within the broader $2.40, $3.10 band unless your roof requires unusual structural work.
A cheap lump-sum quote with fewer watts can actually cost more per watt than a larger, cleaner design. Always ask for the DC system size in kilowatts, the specific module model and count, the inverter type, and the total price before any incentives. Those four numbers let you compute $/W yourself and compare across installers without relying on their marketing math.

Want research like this in your inbox? Become a subscriber, free, no sales pitch.
Become a subscriber →Where the money goes
On a mid-market residential install, the panels themselves typically account for 25 % to 35 % of the total cost. Inverters add another 10 % to 15 %. Racking, wiring, and balance-of-system hardware fill out another 5 % to 10 %. That puts hard equipment costs at roughly half the invoice. The other half, labor, permitting, overhead, and profit, is where bids diverge. Two installers using the same panel and inverter can quote thousands apart based purely on their operational efficiency and customer acquisition costs.
Labor is the second largest line item after modules. A crew of three to four installers will spend one to three days on a typical roof. Electricians handle the panel tie-in and may charge separately. Racking labor depends on roof pitch, material, and whether structural reinforcement is needed. If your roof is steep tile or shake rather than composition shingle, expect a labor adder of $500 to $2,000 or more.
Soft costs explained
Soft costs is an industry term for everything that isn't hardware or installation labor. It includes sales and marketing expenses, permitting fees, engineering stamp costs, utility interconnection applications, insurance, and company overhead. In the US, soft costs have proven stubbornly resistant to decline even as module prices dropped over the past decade. The Department of Energy's benchmark studies consistently show soft costs accounting for 35 % to 50 % of total residential system prices. This is why American solar is more expensive per watt than in markets like Australia or Germany where permitting is streamlined.
Sales channel markup
How an installer acquires you as a customer is one of the largest soft-cost variables. Door-to-door sales teams typically embed $3,000 to $6,000 or more in customer acquisition cost per deal. Online lead platforms charge less but still add to the stack. Direct-referral and word-of-mouth channels are cheapest. When a quote feels high and the hardware is standard, ask how the company found you, the answer often explains the premium.
Why two quotes differ
Beyond sales channel, quotes diverge because of roof-specific variables. The number of roof planes the array spans affects racking and wiring labor. Steep pitch increases installation time and safety equipment requirements. Aging shingles may need replacement before panels go up, some installers bundle this, others exclude it. Electrical service upgrades from 100-amp to 200-amp panels can add $1,500 to $4,000. And local authority having jurisdiction (AHJ) timelines vary from days to months, tying up installer resources and affecting pricing.
Compare line items, not vibes. If a quote sits above roughly $3.30/W with standard hardware and no electrical upgrade, ask what the premium buys. If the answer is vague, it's probably margin.
Financing after the ITC change
The 30 % residential federal Investment Tax Credit for homeowner-owned systems closed after tax year 2025. That changes the math significantly for cash and loan buyers who previously counted on reducing their federal tax liability by thousands of dollars. Third-party-owned (TPO) structures, leases and power purchase agreements, can still claim the commercial ITC at the provider level and pass savings through as an upfront price reduction or lower monthly rate, which is why prepaid TPO often beats a consumer loan in 2026.
Solar loans remain available from specialized lenders and credit unions, but without the ITC to offset principal, monthly payments are higher relative to bill savings. Dealer fees baked into many solar loans, sometimes 15 % to 30 % of the loan amount, further erode economics. If you're financing, insist on seeing the dealer fee as a line item and compare the effective APR against a home equity line of credit or personal loan from your bank.
How to lower your cost
- Get three quotes: enough to see the local price band without drowning in sales calls.
- Ask about remaining state and utility incentives: SRECs, performance-based rebates, and property tax exemptions vary by jurisdiction.
- Consider TPO: if the ITC pass-through lowers effective cost below what you'd pay with a loan, the ownership trade-off may be worth it.
- Time your purchase: end-of-quarter and year-end pushes can produce better pricing from installers chasing volume targets.
- Bundle strategically: adding a battery or EV charger to a solar project can sometimes unlock installer discounts on labor.
Regional price variation
Solar pricing swings by state more than most buyers expect. In 2026, average installed cost ranges from roughly $2.20/W in sunny, installer-dense markets like Texas and Florida to $3.40/W or higher in Hawaii and parts of the rural Northeast where installer competition is thin and permitting is slow. The variation is not primarily about sunshine, it is about labor supply, permit culture, utility cooperation, and how many installers compete for each job. States with streamlined online permitting, like Arizona, process applications in days; states with paper-based AHJs can add weeks and hundreds of dollars in administrative cost that show up in your price per watt.
State-level incentives still exist in many markets even after the federal ITC sunset for homeowner-owned systems. Solar Renewable Energy Certificates (SRECs) in New Jersey, Massachusetts, and Illinois create an ongoing revenue stream from solar production. New York's NY-Sun rebates offer upfront cash based on system size. Property tax exemptions in roughly 35 states prevent the added home value from raising your tax bill. Sales tax exemptions in about 25 states eliminate 5 % to 8 % of hardware cost. These programs change frequently, so verify current availability through your state energy office or the DSIRE database before relying on them in your financial model.
Examples of state variation
- Texas & Florida: low labor costs, fast permitting, high installer competition, often $2.20, $2.60/W.
- California: mature market with NEM 3.0 reducing export value, $2.60, $3.00/W, but battery pairing is increasingly essential.
- Northeast (MA, NY, NJ): higher labor and permits, but SRECs and state rebates offset much of the premium, $2.80, $3.30/W.
- Hawaii: highest electricity rates in the US make payback fast despite installed costs above $3.00/W.
Three quotes is enough to see the local band. More than that and you're mostly collecting sales calls. Dig into line items rather than chasing a fourth or fifth bid. See the full pricing breakdown and ROI analysis for deeper frameworks.
Common questions
Is the federal tax credit still available?+
Not for homeowner-owned residential systems after tax year 2025. TPO providers (leases and PPAs) may still claim the commercial credit and pass through an equivalent discount to the homeowner, effectively lowering the system price or monthly payment.
Does a cheaper panel mean a worse system?+
Not usually. Warranty terms, degradation rates, and installer support matter more than premium branding, especially on a large, unshaded roof where a few points of efficiency difference don't meaningfully change production.
How many quotes should I collect?+
Three solid, line-itemed proposals from different installers will give you a clear picture of your local market. Beyond three, you're adding sales interactions without much new pricing information.
Become a subscriber
Free updates on costs, incentives and panel tech, written for homeowners, not sales teams.
Become a subscriber →